TRANSMISSION & DISTRIBUTION
Compensation for the loss of Lots Road
21 February 2004Installing a series of static var compensators has enabled London Undergroud to connect its problematic load to the UK's national grid after nearly a century of reliance on its own Lots Road plant
In October 2002 UK transport minister John Spellar switched off the last working turbine at Lots Road power station, Chelsea, which had supplied electricity to a large part of the London Underground Ltd (LUL) rail network for 97 years.
The 180 MW plant, constructed in 1905, was originally fuelled by coal, then converted to fuel oil and most recently to gas. This closure of one of the oldest working power stations in Europe forms part of London Underground’s programme to take its power from the National Grid, via London’s local distribution network operator, EDF Energy. In order to fund the new scheme, it was agreed to seek private sector finance. In 1998 London Underground signed a 30 year private finance initiative (PFI) contract with Seeboard Powerlink – a consortium formed by Seeboard, Balfour Beatty and ABB – to manage, maintain, develop and finance London Underground’s power supply system.
Discussions with EDF Energy revealed that the very large power demand, load swings and DC rectification associated with this additional traction load would significantly reduce the power quality for the London area, including for example the computer systems in the city of London, unless corrective action was taken.
A ‘power quality’ variation to the original PFI contract was agreed and most of the specialist work was awarded to ABB who proposed a series of extensive studies of the existing electrical system to be carried out in close co-operation with Seeboard Powerlink. These studies, carried out on ABB’s simulation programme SIMPOW, checked the potential for harmonic distortion and voltage fluctuation under all credible power supply network configurations likely to be encountered. They then ascertained the nature and size of the power quality correction installations needed to ensure that London’s public supply quality remained well within the levels set by national and international norms.
Following the studies, a total of five static var compensators (SVCs) and ten stand-alone harmonic filters (HFs) were installed at critical points of the London Underground
22 kV distribution network and its supply from EDF Energy substations.
Due both to the limited space available and their proximity to underground stations, special measures had to be taken to design compact installations which would also ensure adequate confinement of noise and magnetic fields.
System study
The LUL power system is a 22 kV/11 kV/400V system fed from the national grid (NG) and the EDF Energy network via five grid supply points (GSPs) and four large and two small bulk supply points (BSPs). The points of common coupling (PCCs) for all BSPs are at 132kV.
Varying train loads cause voltage fluctuations, while the 12 and 24 pulse diode converters feeding the trains produce harmonics. As voltage fluctuations and harmonic levels are two different problems two types of system studies were carried out:
• Voltage fluctuation studies
• Harmonic distortion studies
During normal operating conditions the LUL 22 kV network connected to the BSPs is separated into four isolated sub-systems. These sub-systems were included in the studies. Other sub-system arrangements were also studied and these allowed for non-normal operating conditions.
The studies included five SVCs at locations determined both by the physical space available and the need to provide standby electricity redundancy to the normal system configurations.
Voltage fluctuations
It is a characteristic feature of traction loads to exhibit frequent large changes in active and reactive power. These power swings must pass through the impedances of the feeding high voltage networks. Since these source impedances are significant, the traction load variations cause voltage fluctuations. Limits for the voltage fluctuations exist on the feeding 132 kV network as well as the low-voltage systems for traction load and auxiliary services. It was desirable to suppress the voltage fluctuations at each voltage level separately, but such an approach would have been costly and complicated. A more realistic concept for the project was to provide suppression of voltage fluctuations using SVC at the 22 kV system level in order to achieve reasonably low voltage fluctuations both on the 132 kV buses and on 22 kV buses.
The 132/22 kV transformers are equipped with tap changers, used to compensate for slow voltage changes at the 22 kV voltage level, ie changes between peak load and low load periods. The SVCs needed to compensate for load fluctuations only, thereby keeping the voltage fluctuations at the PCCs within the set limit of 1%. This was achieved by integration of the SVC reference towards a constant susceptance, using a long time constant. This time constant needed to be short enough not to interfere with the tap-changer control and long enough to be able to reduce the load fluctuations.
The aims of the voltage fluctuation study were to determine the size of the SVCs, to verify that the locations available for the SVCs were appropriate and to determine the resulting voltage fluctuations for all credible operating conditions.
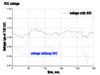
The voltage fluctuations and SVC sizes were determined in dynamic simulations, using loads that vary in time. It was decided to study a five minute period as the voltage fluctuations have a periodicity of about 1-2 minutes. Figure 1 shows a typical example. Load data were based on real-time measurements of the load in 22 kV switchhouses feeding the lower voltage systems. The measured load was upgraded to allow for future traffic growth. Five minute periods with upgraded loads for all sub-system switchhouse loads were combined. The combinations giving the highest positive and negative power fluctuations were selected for the simulations. In this way the SVCs were dimensioned for all conceivable future traffic situations.
The best reduction of voltage fluctuations on the 132 kV side was found to be achieved when the SVCs controlled the 22 kV BSP transformer voltage instead of the 22 kV voltages at the points where the SVCs were ultimately physically connected. However, as there is no physical space available for SVCs at the BSP locations, the measured voltage data has to be transferred to the SVCs, which are actually located elsewhere in the system.
The simulations show that, with a 60 MVAr thyristor controlled reactor (TCR) rating, a substantial reduction of voltage fluctuations is achieved by use of the SVCs. This is demonstrated in Figure 1.
SVC design
Different combinations of TCR and filter ratings as well as filter tunings were tried IN THE SIMULATION until suitable SVC combinations that fulfilled the harmonic requirements were determined. The SVCs each consist of one
60 MVAr TCR and a set of harmonic filters of different tunings and sizes. By phase angle control of the TCR, a continuous variable output from maximum MVAr capacitive to maximum MVAr inductive reactive power can be obtained from steady state.
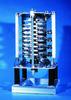
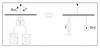
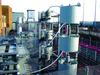
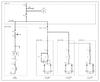
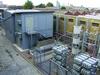
The five SVCs can be subdivided into two basic configurations, Type 1 and Type 2 (see Table 1, Figure 2 and Table 2, Figure 3). A site photograph of one of the Type 2 SVCs is shown in Figure 4.
Key design features
Thyristor valve. The thyristor valve is of BCT type, ie equipped with bidirectional control thyristors. In such devices, two thyristors are integrated into one wafer with separate gate contacts. The two component thyristors in the BCT function completely independently of each other under static as well as dynamic operating conditions. Each component thyristor in the BCT has a performance equal to that of a separate conventional device of the same current carrying capability. The valve comprises only one thyristor stack in each phase instead of two, which offers a very compact valve design (Figure 5).
Iron core reactors. In the SVCs, iron core TCR reactors are utilised instead of the perhaps more commonly known air core reactors. There are two reasons for this :
1. The shortage of space in the London Underground environment requires a very compact physical design of the SVCs. This is better fulfilled by iron core reactors than air core reactors.
2. Due to the close vicinity of the SVCs to populated parts of the Metropolitan area, it is important that their magnetic fields do not exceed acceptable levels. In this respect, iron core reactors are also superior to air core reactors. The magnetic field is required not to exceed 1.6 mT at the boundary of any of the SVCs. Measurements have confirmed that this requirement is indeed fulfilled.
SVC control. The reactive power operating range of each SVC, 60 Mvar, is essential for the overall performance. This is enabled by symmetrical control of the three phases of the TCR branch. The reactive power consumption of the TCR is continuously variable. The main task of the SVCs is voltage fluctuation control, with a nominal voltage of 22 kV. The control slope is variable between 0 and 5% on a 60 MVA base. The reference voltage of the SVCs is between 19.8 kV and 23.3 kV (0.9 pu – 1.06 pu).
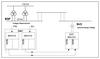
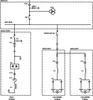
The SVC is controlled by a microprocessor based control system called MACH2. It receives information from the network via voltage transformers (VTs) and current transformers (CTs). Because of space and visual impact considerations the physical locations of the SVCs do not necessarily coincide with the best locations from an electrical performance point of view. To overcome this, the voltage response signal at the 22 kV bus is provided from a remote VT at the BSP. This VT is connected to a dedicated MACH2 data acquisition computer (DAC). The signal is transferred via an integrated service digital network (ISDN) to the MACH2 control system located at the SVC. As a back-up, a redundant DAC and a MACH2 are also connected to the remote VT at the BSP. If both ISDN connections are lost, the SVC will automatically switch to local control. See Figure 6 for a block diagram showing the voltage measurement.
The control system allows either remote or local operation of the SVCs. Normally, the SVCs are operated remotely from a main control centre via a SCADA system. Local operation is performed from the operator work station (OWS) located in the SVC control building. A voltage measurement selection scheme is also included to allow SVC selection to non-standard BSP configurations and standby facilities.
Over- and undervoltage strategies The maximum continuous voltage at the 22 kV bus is 1.06 pu. If the voltage exceeds this level, the SVC will reduce the voltage by changing the operating point to become more inductive.
On the other hand, if the voltage drops below 0.9 pu, the voltage control will send the SVC fully capacitive in order to support the voltage.
This, of course, cannot apply for an unlimited amount of voltage depression. If a voltage collapse appears in the feeding grid it is beyond the capability of the SVC to respond to the situation. Instead, the best thing the SVC can do in this situation is to temporarily go off-line in an orderly fashion, ie to shut down and restart after the feeding voltage has returned. This sequence of events is triggered whenever the system voltage drops below 0.7 pu for more than seven seconds. This is what happened on the 28 of August, when a grid failure resulted in the loss of a BSP. In other words the London Underground SVCs did what they were supposed to do in the situation that ocurred.
Harmonic distortion study
The purpose of the study was to determine the optimum size, number, configuration and location of the harmonic filters needed to limit harmonic distortion for all credible operating scenarios. Future changes in the magnitude and character of the LUL load and in the configuration of the supply and distribution systems had also to be considered. As a result of the study, in addition to the harmonic filters required by the SVCs a total of 10 stand-alone harmonic filters were designed and installed at critical locations in the system.
The complexity of the network to be studied required the preparation of a large model comprising relevant sections of the network from the NG 400 kV and 275 kV power transmission system down to the 400 V auxiliary load level (lifts, escalators, signalling, etc). The model included the source impedances of the supply network, supergrid transformers, mechanically switched capacitors (MSCs), 132 kV/22 kV grid transformers, 22 kV and 11 kV LUL systems, traction supply rectifiers and low voltage loads.
The rectifier converters were modelled
by a harmonic current source in parallel with impedance Z = R(f) + jvL
where R is frequency dependent (Figure 7).
The TCR was modelled as a shunt reactor in parallel with a harmonic current source, representing the harmonic current generation by the TCR. For this study, the non-consistent set of maximum values of all harmonics over the complete load range was used, ie all harmonics were assumed to have the maximum values which they could possibly attain at any point in the TCR load range.
The simulations showed that the harmonic voltage distortion for 132 kV target nodes was within the limits for all defined scenarios and the requirements for connection were fulfilled.
Further reading
R. Grünbaum, M. Noroozian, A. Palesjö, “Connecting the London Underground to the public grid: solutions for safeguarding of power quality”. CIRED 17th International Conference on Electricity Distribution, Barcelona, 12-15 May 2003.
TablesTable 1 Type 1 SVC Table 2 Type 2 SVC