Bringing predictive analysis to the power distribution grid
-
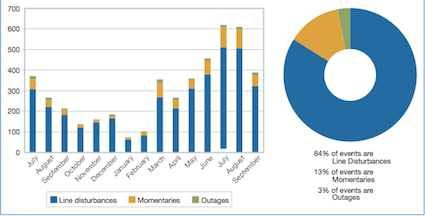
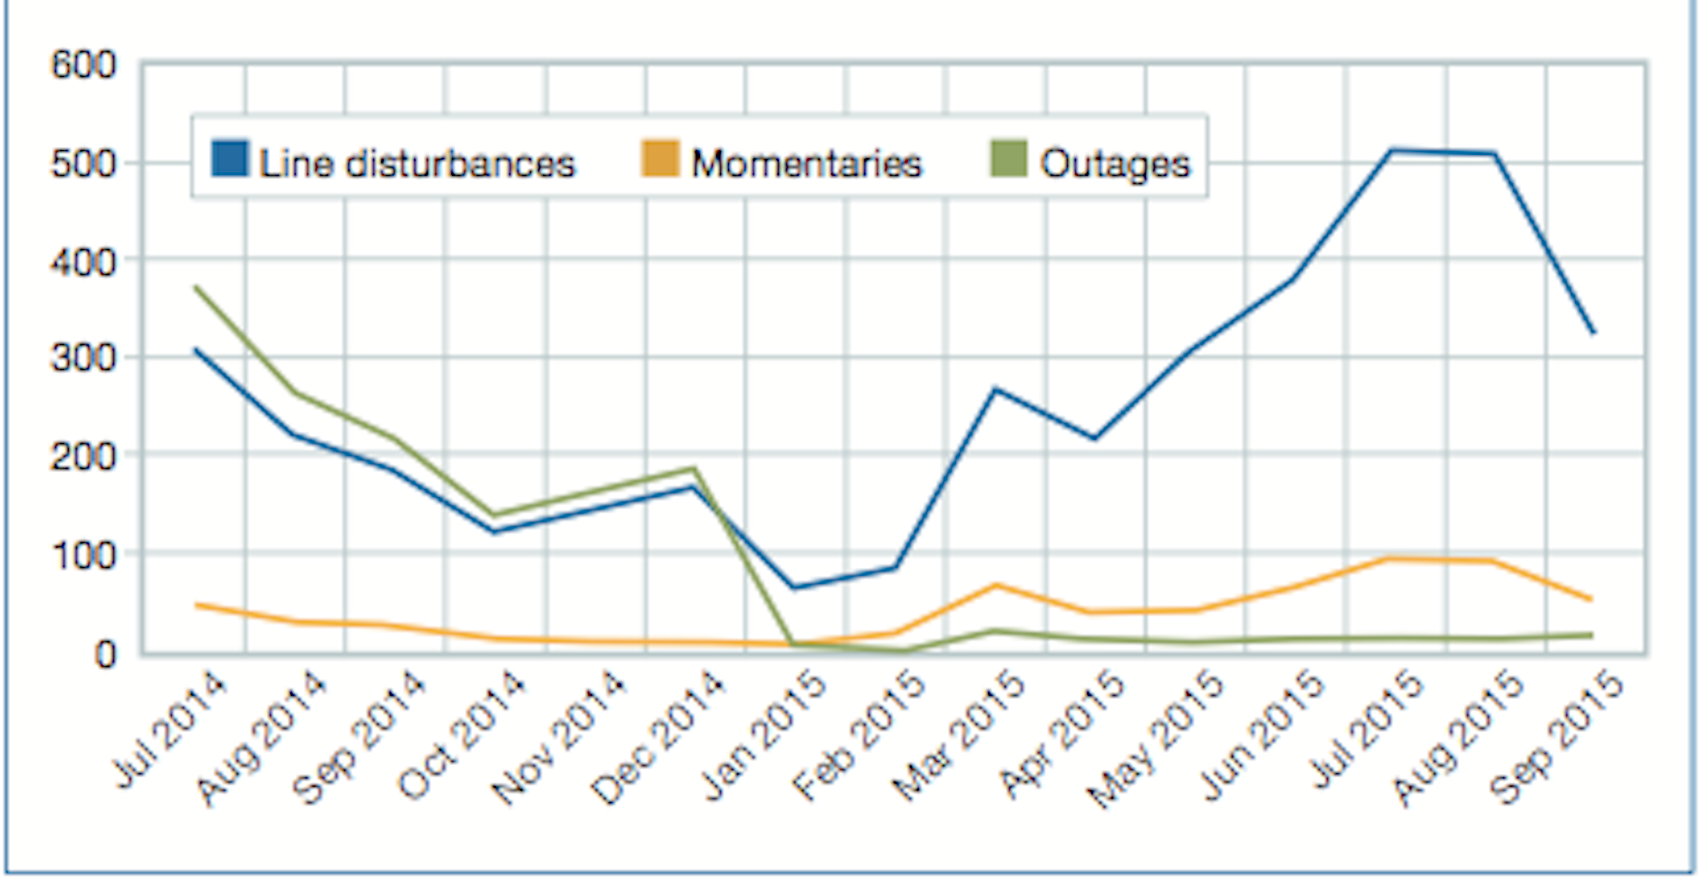
Figure 1. Line events, monthly trends. All data is from Lighthouse sensors in... -
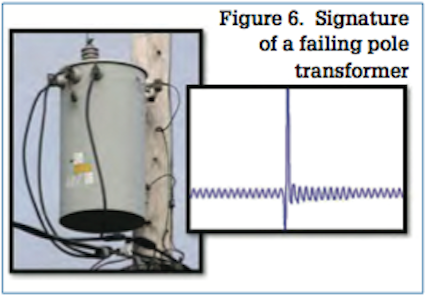
Figure 6. Signature of a failing pole transformer -
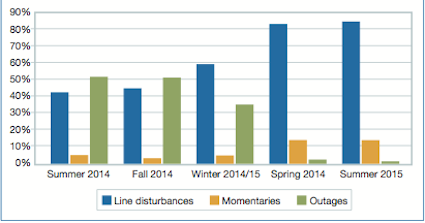
Figure 3. Event type by season -
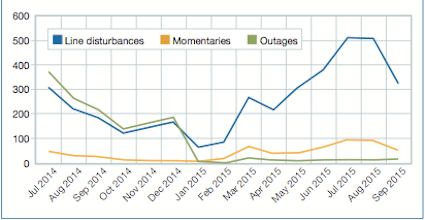
Figure 2. Monthly trends of each event type -
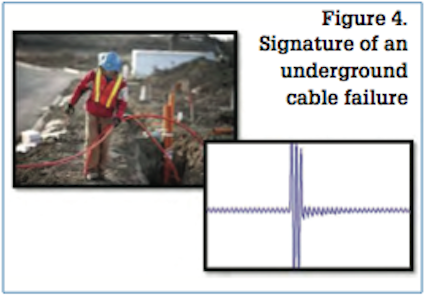
Figure 4. Signature of an underground cable failure -
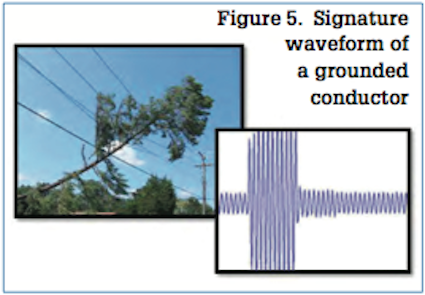
Figure 5. Signature waveform of a grounded conductor