ENVIRONMENTAL IMPACT
Establishing benchmarks for environmental comparisons
1 December 2006The authors have developed a basis for the objective comparison of the environmental impact of large scale electric power generation in the USA. All major options have substantial advantages and disadvantages that must be carefully assessed. The analyses presented here can assist in such an assessment.
An accurate assessment of electric power technologies must include recognition of all the potential land, air, water, solid and hazardous waste, habitat and species, and related environmental impacts (externalities) associated with the technologies. Some electric generation systems may be inherently more or less risky and environmentally dangerous than others; however, such a determination can only be made by objectively and consistently comparing energy unit-equivalent power generation systems, an approach that, while rational, is rarely adhered to.
Environmental and risk analyses must comprehensively estimate the positive and negative externalities resulting (directly and indirectly) from all phases of the energy production cycle and consistent in assessing them. A necessary prerequisite to such analyses is the development of comparable, comprehensive benchmarks for each power generation option. These benchmarks must show the implications in terms of land use, environmental externalities, habitat impacts, employment, and other relevant parameters, standardised to a MW power production equivalent. In addition such benchmarks are useful in themselves to illustrate the requirements and implications of different energy sources for producing an equivalent amount of electric power, compare the benefits and requirements of alternative energy systems, and to indicate the feasibility (or lack thereof) of various power options for specific cities and regions.
Scope and method
The authors developed objective environmental and related impact benchmarks for equivalence based on a 1000 MW generation unit for the ten plant options listed in Table 1.
Where 1000 MW plants do not currently exist, the requirements were scaled up appropriately to approximate a 1 GW plant producing about 8800 GWh annually. All relevant externalities were scaled to allow for the different capacity factors (availabilities) of the power options.
The following exmple concerning land use requirements illustrates the scaling process. On the basis of extensive research conducted by a variety of organisations, we estimate that a 30 MW reference closed loop biomass plant would require about 35 000 acres of dedicated tree plantations. Scaling these land requirements up for a 1000 MW plant indicates that 33.3 x 30 MW biomass plants would require about 1 165 000 acres, or about 1820 square miles. However, since the average biomass capacity is about 70 %, these land requirements have to be further scaled to about 1 664 000 acres, or about 2600 square miles.
The capacity factors used for the different options are: nuclear, 90 %; coal, 75 %; wind, 20 %; oil, 80 %; natural gas, 75 %; biomass, 70 %; hydro, 60 %; solar thermal, 20 %; solar photovoltaics 20 %. While the various options were scaled to allow for differing capacity factors, no attempt was made to account for different levels of intermittency or reliability or the requirements of some options for storage and back-up. Thus, for example, scaling the solar thermal and solar photovoltaic options to account for their low capacity factors does not obviate the problem that, without adequate storage and/or back-up power, these options will lack reliability and will operate only in an essentially fuel saver role.
The major parameters and requirements associated with the operation and maintenance of each unit-equivalent benchmark plant are specified in Table 1. It is important to note that the impacts derived here can be either positive or negative. Some impacts can be strongly negative, such as the acid rain produced by coal-fired plants, the relatively large amounts of particulate matter produced by biomass, the large amounts of land required by the renewable options, and the destruction of fish by hydro plants. On the other hand, some of the impacts of the power generation options can be positive. For example, the SO2, NOx, and ozone produced by the fossil power options can have some beneficial effects on crops and forests; large amounts of land around nuclear power plants have been converted into nature preserves, endangered species habitats, and outdoor recreation areas; biomass plantations help sequester and recycle carbon; hydroelectric reservoirs provide important flood control, irrigation, and recreation benefits.
On-site effects
On-site impacts, as summarised in Table 1, differ dramatically with the criteria considered.
• The land impacts of the nuclear and fossil options are very low to moderate, whereas those of all the renewable options are high.
• The impacts on habitat and species of nuclear power and of a ‘most stringent’ natural gas plant are low, while those of the other options are moderate to high.
• The air impacts of the nuclear options and all of the renewable options except biomass are negligible or low, whereas for the other options, except for a natural gas plant meeting stringent environmental standards, they are high.
• The water pollution impacts and the solid and hazardous wastes generated differ widely among the various options.
• The coal and biomass options tend to have substantial impacts across all the criteria.
• The nuclear plant and the most stringent natural gas plant tend to have relatively low impacts across all the criteria considered.
Environmental impacts
The often dramatic differences in impacts are illustrated in Table 2 and Figures 1 and 2.
• The land requirements for biomass, 2600 square miles, dwarf those of any other option. However, even excluding biomass, the on-site land required for the renewable options are many orders of magnitude greater than the land required for the fossil or nuclear options.
• Coal-fired generation (Table 2) produces, by far, the most SO2, followed by oil and biomass.
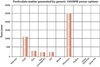
• Figure 1 indicates that the biomass option produces the most NOx, followed by coal, natural gas, oil, and then ‘stringent’ natural gas.
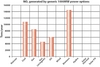
• The particulates generated by biomass (see Figure 2) are the highest, followed by coal.
• The CO generated by biomass (see Table 2) dwarfs that generated by any other option.
Fossil fuels currently provide nearly 70 % of the USA’s electricity, and under any feasible scenario, will continue to play a major and necessary role. However, it is likely that this dominance will gradually diminish. The central question that must be addressed is the role of nuclear power, renewable energy, and other options in substituting for the gradual decline (in both real and percentage terms) in the use of fossil fuels.
Oil is not much used to generate electricity in the US, and the following discussion therefore centres on natural gas and coal. Natural gas is a relatively attractive fuel with important economic and environmental benefits, and it has been used increasingly over the past two decades to generate electricity. It is attractive for a variety of reasons: It is (relatively) environmentally benign, it is indigenously available, recent technological advances in turbine development have made the fuel increasingly viable as an intermediate and base load option, and it is widely viewed in many circles as the "bridge fuel" to a predominately non-fossil energy future.
Nevertheless, there are serious potential problems in relying too heavily on natural gas, even if one leaves aside issues that are outside the scope of this study, such as the fuel’s price volatility, availability of reserves and infrastructure, and use as a feedstock. For this study illustrates that natural gas, while environmentally benign compared to oil and coal, produces substantial emissions. For example, at present, the use of natural gas to generate 1000 MW of electricity will produce, annually, on average, 8400 tons of NOx, 4000 tons of CO, 250 tons of particulates and 875 tons of HC/VOC. These emissions are for the on-site plant generation only, and do not include the environmental emissions and degradation produced by natural gas exploration, drilling, development, transportation, and processing activities. The environmental externalities produced by these "front end" activities are substantial and exceed those produced by the on-site natural gas electricity generation plant.
Even the newest state-of-the-art natural gas plant with the most advanced environmental control technology will generate substantial environmental emissions, and such a 1000 MW plant will generate annually 4300 tons of NOx, 3000 tons of CO, 175 tons of particulates, and 525 tons of HC/VOC. Once again, these figures are for the on-site plant generation only.
Coal has many strong advantages, including low and stable prices, proven technology, and widespread availability. Nevertheless, there is one well-recognised disadvantage of coal as an electricity generation source – it produces substantial amounts of environmental degradation. Despite the important advances in environmental control technology made in recent decades, the combustion of coal still has serious environmental consequences. For example, this study finds that the use of coal to generate 1000 MW will produce annually, on average, 10 000 000 tons of CO2, 10700 tons of NOx, 11 200 tons of SO2, 1900 tons of CO, 1100 tons of particulates, 530 tons of HC/VOC, and substantial quantities of trace elements, eg 2130 lb of arsenic, 1650 lb of lead, 215 lb of mercury, 900 lb of selenium. These figures are for the on-site plant generation only.
The environmental controls for coal combustion will continue to improve and the emissions produced per unit of coal consumed will continue to decrease. However, it will become increasingly difficult and expensive to further enhance the environmental performance of coal combustion, and the rates of improvement will likely decline. Also, while the Vision 21 concept offers substantial promise, there is some ultimate limit to how environmentally acceptable coal utilisation can be made. More important perhaps, even with dramatic improvements in achieving further emissions reductions, coal will remain an environmentally degrading fuel. For example, if over the next two decades technological improvement succeeded in reducing coal-fired generation plant emissions by an additional 75 % (in itself an ambitious goal), 1000 MW of conventional coal combustion would still annually produce about 2500 000 tons of CO2, 2700 tons of NOx, 2800 tons of SO2, and 275 tons of particulates.
Assessing renewables
Renewable energy technologies are currently popular, especially with environmentalists and many special interest groups. Nevertheless a realistic assessment of the benchmark characteristics of these options reveals serious problems.
Hydroelectric generation is a well-established, base load option with significant environmental advantages. However, most major hydroelectric capacity options in the US have long since been exploited, and proposals for new hydro facilities often encounter stiff resistance from environmentalists and others. Further, hydro facilities can have serious consequences for land use, habitat and species, and, especially, fish populations.
Wind energy has received considerable interest in recent years and it is a well established, proven technology that generates few environmental emissions. However, there are three major problems with wind energy conversion systems (WECS). First, wind is intermittent and unreliable. WECS have a capacity factor of about 20 %, and without adequate storage and/or conventional back up, wind is simply not a long term, viable option. Second, wind energy requires a large amount of land for the turbines, support systems, access roads, etc. For example, as estimated here, to generate 1000 MW/8800 GWh annually requires about 250 square miles. Third, wind is not entirely without environmental problems. The large amount of land required can impact animal habitat and species. However, the major environmental problem with WECS concerns avian mortality. It is noteworthy that the National Audubon Society has successfully intervened to prevent the development of some wind projects in California due to the danger they pose to endangered condors.
Biomass power is a technologically well-established renewable energy option that has the great advantage of being able to supply reliable, base load power. However, it has at least three major drawbacks. First, virtually all current biomass plants use wastes from the wood products industries as fuelstock, so for major electricity generation a large number of dedicated silviculture biomass plantations will have to be developed and maintained to provide fuel for closed loop biomass systems. No such plantations have ever been successfully developed, or their commercial feasibility established. Second, biomass is an environmentally degrading energy source. For example, 1000 MW of biomass generation will annually generate 14 400 tons of NOx, 600 tons of SO2, 100 000 tons of CO, 2500 tons of particulates, 5300 tons of HC/VOC, 2600 tons of methane, 1600 tons of TOC, 39 000 tons of ash, and 29 000 tons of herbicides. Given the scale of these environmental externalities, the vastly increased use of biomass to generate electricity in an increasingly emission-constrained environment must be seriously assessed. Third, the prodigious amount of land required for biomass energy plantations is simply not recognised: 1000 MW of biomass generation requires about 2600 square miles of arable, fertile land.
The remaining two renewable energy options for large-scale electricity generation are central receiver solar thermal power and utility scale photovoltaics. Both have serious disadvantages.
Neither has yet been proven to technologically viable for substantial, long term, reliable electricity generation, both are far from being cost competitive, and both suffer from intermittency and unreliability problems worse than those of WECS. Owing to their high annual insolation requirements, both options are unsuitable for the climactic and weather conditions in much of the US.
The land requirements for both options are substantial, and for 1000 MW could range between 40 000 and 70 000 acres. In addition, the environmental effects of the large amounts of materials required in solar thermal and PV systems are, at present, incompletely understood. For example, there are substantial environmental, health, and safety hazards associated with the manufacture, use, and disposal of solar PV cells. Some feedstock materials used in PV cells are toxic, carcinogenic, pyrophoric, or flammable, and the actual hazards to health posed by these materials depend on their inherent toxicological properties and the intensity, frequency, and duration of human exposures. Widespread utilisation of photovoltaic technologies, such as the installation of 50 square miles of PV cells to approximate a generic 1000 MW power plant, will require that serious attention be given to these hazards as they relate to the sources, processing, usage, and end-of-product-life disposal.
Photovoltaic modules contain regulated materials, which vary from one technology to another (e.g., cadmium, lead, selenium, copper, nickel, and silver), and environmental regulations can increase the cost and complexity of dealing with end-of-life PV modules. If they are classified as hazardous according to Federal or state criteria, then special requirements for material handling, disposal, record keeping, and reporting will escalate the cost of decommissioning. For example, several of the current state-of-the-art cadmium telluride modules failed the USEPA Toxicity Characteristic Leaching Procedure (TCLP) for potential leaching of cadmium in landfills. Similarly, current crystalline silicon modules failed tests for leaching of lead. Consequently, such modules may be classified as hazardous waste.
In most PV systems, the primary hazardous materials that are of concern and that are cited in the Resource Conservation and Recovery Act are the storage batteries and the tin-lead solder used for interconnecting the individual solar cells and assembling them into panels. These materials meet the hazardous waste standards specified in RCRA. However, systems using tin-lead solder do not meet the more stringent total threshold limits concentrations of the California hazardous waste control laws (HWCL). The California HWCL includes second level acidic environment tests, and specific limits are set for such material as selenium, lead, cadmium, etc., which are lower than the Federal law.
The PV industry has no established uniform procedures for disposing of used PV systems, nor does it have a long-term, comprehensive plan in place for disposal and decommissioning. Suggestions have been made that it follow a collective approach modelled after that of the Rechargeable Battery Recycling Corporation. Nevertheless, at present, economic incentives are inadequate to move the PV industry to voluntary compliance, and additional incentives and/or regulation may be required.
Assessing nuclear power
The nuclear option is a proven, cost-competitive technology widely used throughout the USA and is currently generating 20 % of the country’s electricity. On-site plant operations are environmentally benign, generate negligible air and water emissions, and contribute negligible greenhouse gases to the atmosphere.
However, nuclear power does suffer from problems relating to health and safety issues, potential accidents, and waste disposal. Further, many environmentalists and special interest groups are strongly opposed to any expansion of nuclear power.
Employment – main findings
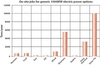
O & M requirements for the unit-equivalent options have very different jobs impacts. These are summarised below, and illustrated in Figure 3.
Nuclear Energy Compared to most other electricity generation technologies, nuclear power has a relatively high full-time-equivalent (FTE) per MW staffing requirement during normal operations. This is a result of the technical and regulatory environment under which these plants must operate for, unlike most fossil power plants, a nuclear facility must maintain a significant on-site engineering staff that can respond to NRC mandates and information requests. There are also many complex engineered systems that require maintenance and surveillance. Many large utilities have large central staffing which also deals solely with their nuclear plants. These latter are not counted here, as this is a site-specific study.
A 1000 MW nuclear power plant will normally require between 700 and 800 full-time, on-site employees. During refueling, the on-site FTEs may increase by 100 or more.
Coal On the basis of actual employment in existing plants, we estimate that 1000 MW of coal-fired capacity requires between 700 and 800 on-site employees.
Natural gas, oil On the same basis as that for coal we estimate the equivalent figures for natural gas and oil respectively to be 150-250 and 125-200 employees.
Wind Large-scale WECS projects vary widely in their on-site operations and maintenance labour requirements. Two extremes that illustrate this are the 25.5 MW Indian Mesa 1, Texas, (2.1 MW per O&M job) the 150 MW Trent Mesa, Texas, at 19.75 MW per job. From the average it is reasonable to estimate that 1000 MW of wind power will require between 125 and 300 on-site O&M jobs. Allowing for the 20 % availability factor indicates that the number required to generate 8800 MWh lies between 600 and 1500.
Biomass The total annual labour hours for a 30 MW dedicated biomass facility are estimated to be: production and harvesting, 113 000; transportation, 42 000: generation, 71 000.
Annual labour hours total 226 000, or about 118 full-time jobs. Multiplying this figure by 33.3 to scale to the generic 1000 MW, and then scaling this figure to account for 70 % availability indicates that a total of about 5600 on-site, FTE jobs will be generated annually.
Hydro On the basis of an analysis of the employment at major hydroelectric facilities in the USA and Canada, we estimate that the benchmark 1000 MW of hydro capacity will generate about 125 - 200 on-site jobs. This does not include the thousands of people employed in mitigating the impact on fish populations caused by some hydro facilities. For example, since the early 1980s, fishery issues (particularly salmon) have become a leading concern, especially in the Pacific Northwest of the USA. At Federal projects alone, at present, more than 2000 people are currently involved in helping to restore salmon populations.
Solar thermal On the basis of the experience with experimental solar thermal power plants and of STP feasibility studies, we estimate that the benchmark 1000 MW of STP capacity will generate about 600 – 800 on-site jobs. Scaling this to account for the 20 % STP capacity factor indicates that the unit-equivalent will require between 3000 and 4000 on-site employees.
Solar photovoltaics On the basis of the experience with experimental solar PV grid-connected central station power plants and of PV feasibility studies, we estimate that the benchmark 1000 MW of Solar PV central station capacity will generate about 2000 - 3000 on-site jobs. Scaling this to account for the 20 % central station PV capacity factor indicates that the unit-equivalent will require between 10 000 and 15 000 on-site employees.
This estimate is subject to a higher degree of uncertainty. Existing solar PV grid-connected central station power plants in the US have a maximum size of 1 MW, and scaling to 1000 MW and then accounting for capacity factors is very difficult. It is likely that if any large central station PV power plants are ever constructed, the jobs requirements will not increase linearly and will benefit from economies of scale. Thus, the FTE employment estimates derived here should be considered to be maximum estimates.
Figure 1. NOx generated by generic 1000 MW power options Figure 2. Particulate matter generated by generic 1000 MW power options Figure 3. On-site jobs for generic 1000 MW power options