Transmission & Distribution
Tension based real time monitoring untaps hidden potential
1 May 2009Real time ratings of overhead transmission lines – based on continuous monitoring of mechanical tension – tend to be higher than the static ratings that are conventionally used. Many lines are underutilised most of the time, creating opportunities for getting more out of the existing assets. James Varley reports.
Utilities operating transmission systems measure just about everything under the sun,” says Sandy Aivaliotis of The Valley Group (now owned by Nexans), but, remarkably, “they don’t know the true capacity of their overhead transmission lines”, which varies with changing weather conditions. This lack of information was implicated in the northern USA/Canada blackout of 14 August 2003.
What is needed is real time (aka dynamic) monitoring, the objective of which, he says, is to “harness existing, untapped transmission capacity with deterministic safety.” In other words the real time rating of a line can be seen as a form of “hidden transmission capacity to which additional generation can be connected”, with transmission owners able to “transmit up to 30% more power over 90% of the time.”
The benefits of using real time ratings for transmission capabilities rather than static (or book) ratings (which are normally based on a set of conservative assumptions such as high ambient temperature, high solar radiation, and low wind speed), have already been demonstrated in a number of instances. These benefits include: getting more out of existing transmission assets (since use of static ratings means that perfectly good conductors are underutilised much of the time); elimination of unnecessary and risky interventions by operators (eg when lines are judged to be at or very close to their static limits (but in reality capable of carrying significantly more load)) hence improving network reliability and efficiency; addressing line congestion problems; helping the integration of wind into the existing grid, enabling more wind power to be delivered to load centres using the existing infrastructure; and deferral of transmission line upgrades.
A new driver generating increased interest in real time monitoring, says Sandy Aivaliotis, is the smart grid. He notes that real time line ratings are recognised as part of FERC’s Smart Grid Policy (published in the Federal Register on 26 March 2009) and also points to a US DoE document published last autumn, The smart grid: an introduction, which talks about “monitoring and reporting line conditions in real time” with advanced sensors enabling “more power to flow through existing lines.” Indeed, he sees real time monitoring as an enabling technology of the smart grid.
Tension technique
Of the various technologies for real time monitoring of overhead transmission lines it turns out – perhaps surprisingly – that a tension based technique has a number of positive features, including robustness, accuracy and the ability to absorb a range of variables into a single measure. In particular, all the environmental factors affecting the temperature and thus load carrying capability of the line, such as wind speed and direction (which can change very quickly, erratically and substantially) and are by far the most important determinants), solar radiation and ambient temperature, are resolved into a single variable: tension. The tension measurement essentially “turns the line into a very big and continuous hot-wire anemometer” says Aivaliotis. The technique also addresses issues such as the as-built condition of the line, variances in materials, construction techniques, maintenance and ageing.
In addition the tech-nology reflects average temperatures in the conductor, rather than surface temperature (as measured by fibre optics, for example), which can be significantly different from the core temperature, and temperatures measured at a single point. Knowing how greatly wind conditions can vary over time and within a very short distance along a line, Aivaliotis is sceptical about the benefits of measuring temperatures at a single point. “Such temperature measurements may not merely be inaccurate but may also be misleading,” he says, “as they may report a low temperature at one point when in fact the line may be limited by a high temperature a few hundred meters away where the wind cooling effect is not the same.”
The Valley Group system (called CAT-1) works by installing load cells (Figure 1) into stretches of line to measure mechanical tension.
The relationship between tension and the average temperature of the conductor is calibrated using proprietary techniques, including a patented device called a net radiation sensor (NRS). The NRS is the same diameter and colour as the line and installed on a transmission tower close to the line and aligned with it. Since the NRS sees the same weather conditions (sun, wind rain, etc) as the conductor it is at the temperature the conductor would be at without any load.
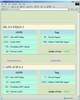
Data from the load cells and net radiation sensors is processed using a special algorithm and generates information for the operator on average conductor temperature, sag, clearance and real time rating (ampacity). The system interfaces with the grid operator’s own EMS/SCADA and the information is presented in a form tailored to the operator’s requirements and in a format that he is familiar with (Figure 2). To avoid data clutter it can operate “in the background” – only alarming when particular conditions arise, eg impending clearance violations.
Typically the CAT-1 display shows: real time capability (ampacity) of the line; present line current; how much additional capability remains; current state vs real time capability; how close the line is to allowable sag limit; and time until the present sag increase might cause a clearance violation.
The remote equipment is self powered (using solar panels) and the system can be deployed quickly (eg 3-5 days for a 20 mile (30 km) circuit) and relocated to other circuits as needed.
It has also proven cost effective, typically providing 10-30% more capacity at about 5-10% of the cost of upgrading an existing or installing a new line. It is also able to detect 1 mm of ice.
Real time ratings in reality
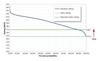
Figure 3 shows an example of how the use of real time ratings helped an operator safely manage a high load event. Before the event the line was operating within limits in accordance with NERC standards. Without real time monitoring this event would have to be reported as a violation, or the operator would have been forced to move the grid off its optimum (ie most secure) dispatch mode. The use of real time ratings allowed the contingency to be safely managed.
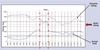
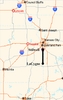
An example of how tension based real time monitoring has been used to address a line congestion problem comes from the 345 kV 1251 MVA (static rating) 32 mile long LaCygne–Stilwell flowgate near Kansas City, a major bottleneck in the central US north–south power corridor (see Figure 4). In one instance during a summer season use of real time monitoring enabled KCP&L to operate the line above its static limit for 167 hours, avoiding a “significant amount” of redispatch.
Before installation of real time monitoring it had been necessary to curtail firm and non-firm contracts due to the limitations of the flowgate. But with the move to real time ratings there was no curtailment of firm contracts and increased capacity for non-firm contracts. The real time monitoring installation was estimated to have a payback time of less than three months.
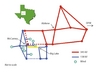
Another practical example of tension based real time monitoring, this time to help with the integration of wind into the grid, can be found at the McCarney transmission hub in Texas, which receives power from a number of wind farms in the area. In Texas, as elsewhere, the best wind resources tend to be far from load sources and existing transmission capacity is generally limited in the vicinity of wind farm sites. Also wind farms are being added faster than transmission lines can be built and while new transmission capacity is planned it will take years to build. A particular problem for AEP was that the rating of the 138 kV McCarney to Big Lake line (yellow line in Figure 5) was limiting the amount of power that could be delivered to load centres in eastern Texas.
Tension based real time ratings enabled an immediate 10-15% increase in the amount of power that could be transmitted using the existing assets (Figure 6). It proved possible to cancel a 20 million dollar line upgrade, which in any case would have become a stranded asset once planned new transmission lines were completed.
Another intriguing aspect of real time rating in the wind context, which Sandy Aivaliotis draws attention to, is that as wind speed rises the output of wind farms increases but so does the real time rating of nearby overhead transmission lines (a common static rating assumes 2 ft/s wind speed, but if speed is 4 ft/s rating increases by 15%). It remains to be seen whether in the future real time monitoring can be used to make practical use of this fortunate set of circumstances in accommodating wind power on the grid.