Operation & maintenance
Using inside information to monitor machinery health
1 November 2006We all know the phrase “seeing is believing.” But in the world of power plant condition monitoring, if you are looking at the overall vibration of the machine, then seeing is “I believe I have a problem.” If you are looking at the real-time position and motion within your machine, then the value of seeing moves from believing to understanding.
It has been estimated that some 40-50% of equipment malfunctions are related to poor operating practices, while 70% of machine failures can be traced to human error. Only 10% of all machines “just wear out” over time.
When operators don’t have feedback telling them that what they regard as “normal” production states and production processes are actually damaging the machines, they are effectively operating blind, without knowledge that their actions are directly impacting upon machinery health.
When asked, “are you monitoring the health of your rotating machines?” many plants respond that they are indeed monitoring machine health, via measurements of temperatures, inlet and outlet pressures, and overall vibration. But that’s not giving them the full picture.
Consider the main turbine at a power plant being brought back on line after a turnaround. As the turbine is coming on line, steam is applied, which causes the rotor to expand, and the case to expand. Do the rotor and case expand at the same rate? How close is the rotor getting to the case? Have the seal clearances changed after the turnaround? Anything loose? Oil supply good? Alignment OK? Is damage being done as the turbine comes on line? And furthermore, if it is, can the damage be quantified? With 100 000 pounds of rotor and 12 to 18 mils of clearance, rotating 50 (or 60) times per second, it is helpful to know the answers to these questions.
Overall vibration is only a symptom
Typically, only overall vibration and temperature are being measured. If the rotor begins to rub the seal, or the alignment was off, or a set of bolts was left loose, when the situation gets bad enough, vibration will go through the roof, then trip the machine – and then you won’t have to wait long before someone wants answers. What if you could have answers before the machine trips? Measuring overall vibration is not an answer. Overall vibration is a symptom.
Imagine that when the turbine is brought on line, you were asked to watch it, and report anything strange you “see.” That’s basically all you are doing with overall vibration monitoring. Maybe you see the turbine shaking, or a red hot bearing, but what is going on inside? Many other clues are available, and missed, leading up to an event.
With overall vibration monitoring, the turbine is brought up to power, an anomaly is present, and finally vibration gets bad enough to trip the machine. The damage has been done and discovery of the cause begins with opening of the turbine casing. Where do you start?
Now, imagine that you have X-ray glasses, enabling you to see inside the casing and watch the rotor, reporting abnormal positions, abnormal motion, or lack of clearance, and that in addition your colleagues have these same powerful glasses and you are each standing at a bearing and asked to do the same thing, communicating and correlating their findings with you and each other.
This is effectively what happens with live machinery health monitoring. The rotor inside the turbine is monitored live as the turbine is being brought online. A seal rub can be monitored as critical resonance speed is achieved. A decision can be made to “grind” through the critical, or a decision made to bring the turbine back down and re-align. Any problems arising are immediately detected, the problems are quantified, and decisions are made in real time. Not decisions such as whether to shut down or keep running, but decisions relating to adjustment of the start-up procedure in real time, ramp rate, or getting staff and parts staged for a quick turnaround for a known problem.
Each turbine start up may be unduly decreasing turbine life. Having live feedback can extend turbine life and improve outage planning. When such a large proportion of anomalies are human induced, monitoring and feedback to humans can be regarded as insurance.
Benefits during operation
The benefits of live machinery health monitoring are not limited to start up and shut down conditions. An additional benefit is production state monitoring, while the turbine is running under load. During start up and shutdown, monitoring and recording turbine changes v rpm live is an extremely important activity. During operation, monitoring and recording changes over time and changes v process parameters are extremely important.
During the turbine production state, if rotor motion, position or vibration phase (machine health parameter) changes, these provide clues that will help maintenance staff plan for the next outage. It is difficult to plan maintenance around a vibration parameter called overall vibration. This is like understanding how loud some music is playing with no clue as to the song or instruments.
Take the example of a brand new rotor with a microscopic metallurgical defect imbedded during the manufacturing processes. After installation, and after being subjected to repeated start-ups where the tension between the rotor surface and rotor core can exceed 35 kN just from surface to core temperature gradients, this small microscopic defect begins to propagate. Over time, the amplitude of rotor vibrations associated with this type of defect may increase but then actually decrease, even though the problem is getting worse! How can rotor vibration decrease as a crack develops? The reason is that the phase (direction) of the vibration may change. That is, 4 mils of vibration at 0 degrees changing to 3 mils of vibration at 180 degrees is actually a change in vibration amplitude of 7 mils.
If you were only trending the overall vibration – which increased to 4 mils, thereby getting your attention, but then began to decrease to 3 mils – you might have allowed yourself to relax a little, thinking that the machine was “fixing itself”, when actually the net change in overall vibration was 7 mils.
A machinery health monitoring system (such as the CSI 4500) will alert the operator or vibration analyst to the amplitude and phase change early enough to give a warning that a potential problem is developing over time and capture enough information to locate the area of concern and provide the basis for describing the actual machine problem.
With a machinery health monitor, the history of the turbine can be recalled and analysed to visualise trends and machine characteristics over time.
For example, a symptom of a shaft crack is changing 1x (once per revolution) vibration amplitude and its corresponding phase. However, neither is guaranteed to just simply increase. What is important? Monitor the change at all bearings and utilise various plot types to confirm.
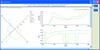
Trend parameter bands specifically defined for 1x and 2x (twice per revolution) for all bearings will help confirm the findings. Another symptom of a shaft crack is changes in the 2x amplitude (ie amplitude of an event occurring twice per revolution) and its phase shift. Also, at start-up or shutdown, critical frequency changes are an indication of turbine system stiffness changes. A crack decreases the stiffness of the rotor as the crack propagates, so a Bode plot will show that the critical resonance frequency of the turbine system has now decreased. The machinery health monitor allows you to overlay previous start-ups plots with live start-up data to visualise changes.
Continuous live transient data provides answers to key questions when you are starting-up the turbine, bringing the turbine offline, or when the turbine is in normal production state. With transient monitoring you can “see” the live motion of the rotor at each bearing location, view the average rotor position at each bearing location, and analyse specific vibration frequencies that correlate with specific anomalies.
Malfunctions are never one time events. Usually, they are a series of smaller events leading up to one large event. Machinery health monitoring can provide up to a 60 hour history of the turbine that you can replay as if you were monitoring the turbine live. This is like multiple angle instant replay. Sometimes when you experience an anomaly live, you might not have been looking at the “optimal camera angle.” Replay mode allows you to look at different bearings with additional plots to precisely confirm your assumptions.
Sometimes a picture is worth a thousand words. By building a 3D turbine model, and playing the recorded turbine data through the model, a live representation of rotor movement relative to case, and case movement relative to foundation can be animated.
For example, you have a probe mounted on the bearing case, the shaft is moving at 3 mils at 0 degrees phase, and the bearing case is also moving at 3 mils and at 0 degrees (that is, with each revolution of the shaft, the rotor and the case move together, back and forth, 3 mils). While an overall vibration reading would be 0 mils as seen by a sensor mounted to the case looking at the rotor, your 3D turbine model shows the rotor and the case moving 3 mils relative to the foundation. 3D modeling included with a turbine machinery health monitor is a powerful animated tool that can help convey machine problems to many other departments unfamiliar with vibration analysis.
Over time, with machinery health monitoring, as opposed to overall vibration monitoring, malfunctions such as foundation changes, coupling problems, blade or rotor cracks, imbalance conditions can be quantified and maintenance planned before a trip has you starting an investigation.
Avoiding unpleasant surprises
Machinery health monitoring is a direct method of checking the condition of the machine, and correlating with process conditions providing the complete picture an operator needs to know exactly the effects of his actions on machine health.
Many plants or refineries are familiar with overall vibration monitoring in the form of machinery shutdown protection. A problem develops, or unknown to the operator, an operator action causes damage, such as a rotor rub on a bearing which begins to progress towards catastrophic failure. A machine trip is analogous to the boss suddenly showing up and standing in the door way and staring at his operating staff. They know that there is a problem, but don’t know yet what the problem is. If they had been monitoring the situation more closely, they probably could have completely avoided the surprise trip and/or the surprise boss visit.
If the machinery protection is working properly, it will shutdown the turbine before catastrophic damage occurs. But this does your bottom line no good.
With direct, live monitoring of the clearances and machine motion, you know that you are damaging your turbine, and you know how you are damaging the turbine. You can make business decisions to reduce load to extend life, or maintain load to meet production demands knowing all the while exactly what effect your decisions have on turbine health and the impending repair. What is key is that you know. You are in control and you are making the decisions.
Machinery health monitoring is knowing what individual faults are contributing to that overall vibration signal. Overall vibration is adding all of the faults together in the system and giving you a single overall value.
The relation of overall vibration monitoring to machinery health monitoring is analogous to the relationship between the volume levels of a song and the individual components of a song that the brain has the ability to dissect. The audio speaker can be seen as analogous to the machine being monitored. You have one source that is sending you a lot of information. The instruments the speaker reproduces are much like machine vibrations due to different fault types. Your ear, the music (vibration) analyser, can detect changes in volume, but also can detect trumpets, drums, guitars etc, because each one of these instruments has its own frequency characteristics. The machinery health monitor has the ability to “hear” all of the “instruments” in the machine. The overall vibration monitor only knows how “loud” the machine is. It cannot “hear” the individual fault types that are present.
When a turbine is started up, 600°F steam is admitted, eventually topping out near 1000°F. The internal rotor temperature can differ from the external rotor temperature by 200°F for 24-48 hours. The rotor and the case can expand at different rates upon start-up.
You may only have 12 to 18 mils of clearance on a 60 foot rotor turning at 60 times per second. 5 mils of bow, a few mils of misalignment and a bit of imbalance, coupled with a boiler upset that quenches your rotor blades, and you might have metal to metal contact.
Thermal bow during start-up is a critical parameter for monitoring live.
If the shaft bows due to improper steam application, and binds, thousands of pounds of force can permanently deform the rotor. Improper start-ups can puncture seals reducing turbine efficiency.
Furthermore, turbines need to be monitored for changes over time during production, changes with rpm at startup and shutdown, changes and settling during slow roll and even when stopped.
Machinery health production state monitoring, when the turbine is online producing power, is a different style of monitoring from “steady state” monitoring. Production state machinery health monitoring has the ability to capture and track changes over time, and correlate changes with process conditions when the machine’s state is not so steady. Often there are changing loads, temperatures and pressures that have an effect on vibration and machinery health. The key difference in production state monitoring is the ability to continuously capture, rewind, and replay the event even when the rpm is not fluctuating.
Turbine startups and shutdowns are rapidly changing events that are complicated by changing speeds, process parameters and machine condition. Monitoring and capturing information from all bearings, live, and simultaneously helps provide more clues to machine health as conditions change. Comparison to baseline is critical as changes are evaluated. These technically challenging modes of operation generally require advanced processing, advanced capture methods, and a turbine specialist on hand or available remotely to monitor the start-up.
Even when the turbine is stopped, the trained analyst will take time to look for adjacent machine vibration, and capture bearing clearance information since the shaft should be sitting at the bottom of the bearing. This information helps determine starting positions, and helps differentiate electrical problems from mechanical problems.
Hardware advances
Turbine start-ups, coast downs, production state and slow roll monitoring are some of the most technically challenging scenarios in which the machinery health monitor and analyst will be confronted. However, with advances in hardware and software design, the CSI 4500 Machinery Health Monitor can continuously capture production state, start-ups and shutdowns in a way that was never possible before, with features such as:
• live turbine dashboard showing rotor position and motion simultaneously for all bearings;
• data recorder continuously capturing all bearings simultaneously so that data needed is not missed, and so that various replay angles can be viewed;
• 3D turbine animation to graphically analyse and convey results to plant personnel;
• simple setup because turbine data is too critical to miss; and
• smart data search and extract because time is money.
Today, technology is available to continuously peer inside your machine and make business decisions as to how to operate your turbine and plan maintenance. If a machine is critical enough to trip offline with an overall level monitor, it is critical enough for machinery health monitoring to be used to provide advance warning on where the fault lies and what the fault is.
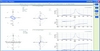
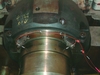
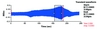
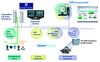
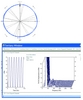
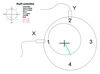
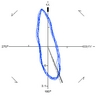
Instrumentation for existing machinery protection monitoring can simultaneously be used for machinery health monitoring. The photograph shows two non contact eddy probe sensors in two planes, 45 degrees off top centre, that provide input for measuring actMachinery health monitoring for turbo machinery includes measuring position and motion simultaneously at all bearings along a turbine train. It is important to correlate the position and motion at all locations simultaneously and during all operating modeContinuous waveform plot. Diagnosing machinery health involves capturing extended time plots so that vibration v time and vibration v rpm can be correlated. A continuous time waveform from each sensor point is the raw information from which all other vibrOrbit plot. The plot on the left is an orbit plot in machinery health software that shows the actual path of the shaft centreline as seen by the sensors (Y and X). The diagram on the right is a cross section of a turbine bearing and shaft viewed axially. Shaft centreline plot. The figure on the left is a shaft centreline plot. The blue data points represent the average position of the shaft inside the bearing. The shaft should rest at the centre and bottom of the bearing at zero RPM. The shaft then rises A flattened orbit shows restricted movement in the horizontal direction and loose movement in the vertical direction. A shaft-to-bearing rub or misalignment can produce this orbit shape Start-up, Bode, polar plot. A key function of the sleeve bearing in turbo machinery is to dampen the vibration so that the turbine passes through the critical speed safely. The more peaked and narrow the amplitude is the less dampening is being performed Start-up, Bode, polar plot. Machinery health software can provide tools to drag known good start-up plots (green) onto plots where the current live start-up is occurring (blue). Quickly visualising changes and exceptions is the key to increasing decision Cascade plot. The frequencies associated with some turbine malfunctions, such as cracked or broken blades, will change as the turbine speed changes. Other malfunctions such as an electrical problem, will not change frequency as the turbine speed changes. Turbine coast down mode. Monitoring a machine at coast down is the only time you can get a true visualisation of the machine health without the affects of the process (such as load during production or temperature variations at start-up). After the turbinLooseness. A characteristic of a loose part in a turbine is 3 - 8x peaks in the spectral plot as shown. Count the major peaks in the spectral, and the 3rd peak to the 8th peak are much higher than normal. Looseness is usually associated with a step changeModes of instability: whirl and whip. An oil instability malfunction known as oil whip is a severe condition that can be easily seen with the orbit plot as the shaft consumes the entire clearance of the bearing and the phase changes wildly around the orbiAn integral system. Machinery health integrated to process control can provide the right information to the right people. In this example the operator was alerted to a simple overall vibration alarm with the Emerson Ovation process control system while thPlantWeb architecture, Ovation process control and the AMS suite for machinery health management