Solar flair – or solar eclipse?

-
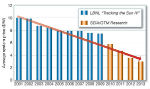
Figure 2. Average PV system price in the USA 2001– 2013 -
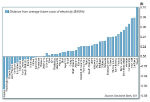
Figure 5. US states, grid parity after 2016 with ITC stepped down to 10% -
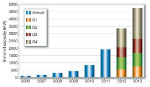
Figure 1. New US PV installations by capacity 2006 – 2013 -
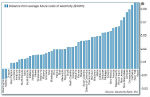
Figure 4. US states grid parity in 2016 with 30% ITC -
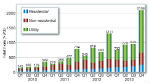
Figure 3. US PV installations by quarter 2010–2013